Aviation is responsible for the 2% of greenhouse gas produced by man. For 2050 the European Union established the objective of reducing the 75% of CO2 emissions per pax and kilometre in commercial aviation. In the recent years, the aviation industry is revealing a lot of new planes or re-engined that are pushing the fuel consumption to new levels, new composites, new engines, new aerodynamics, etc. combined with new operational procedures in airports and air navigation, better routes and occupations rate, etc. are increasing the efficiency in terms of fuel consumption and its emissions, particularly CO2 and NOX, but this is just the beginning of 2050 goal. In this article, I´ll be playing with data, playing to answer a simple question, how much CO2 are polluting commercial aviation in a certain moment? It is just a challenge but I tried to develop an exercise for chasing the numbers. Unfortunately, the open data available made it very challenging, so I developed a little approximation with basic data and methods.
The other challenge I wanted to face is to calculate (far estimating) the numbers in real time with real flights at any moment, not with past flights. Let’s see what happened.
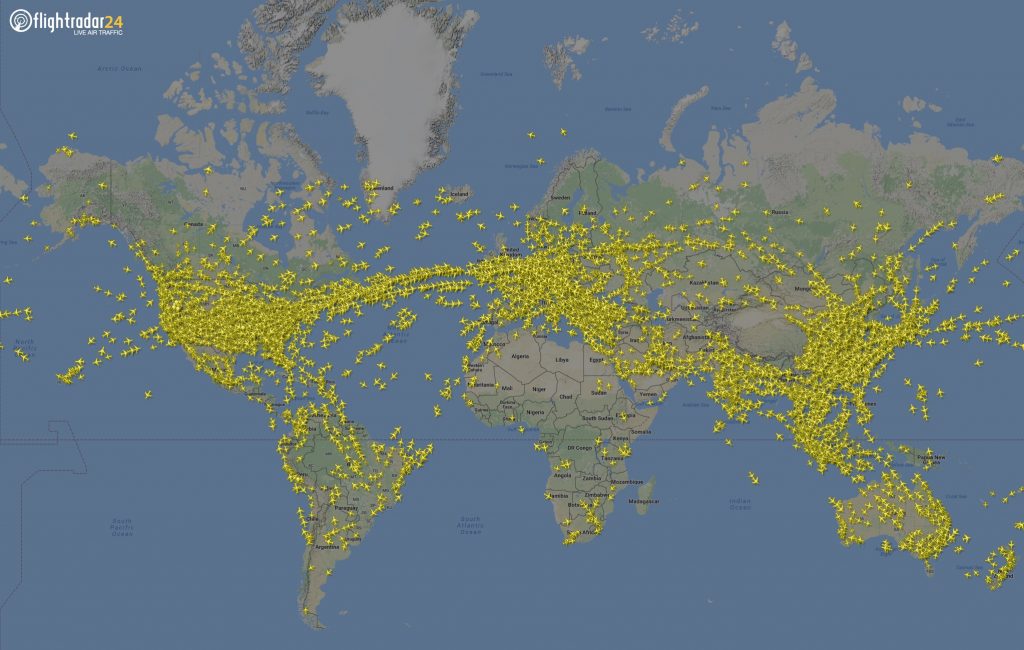
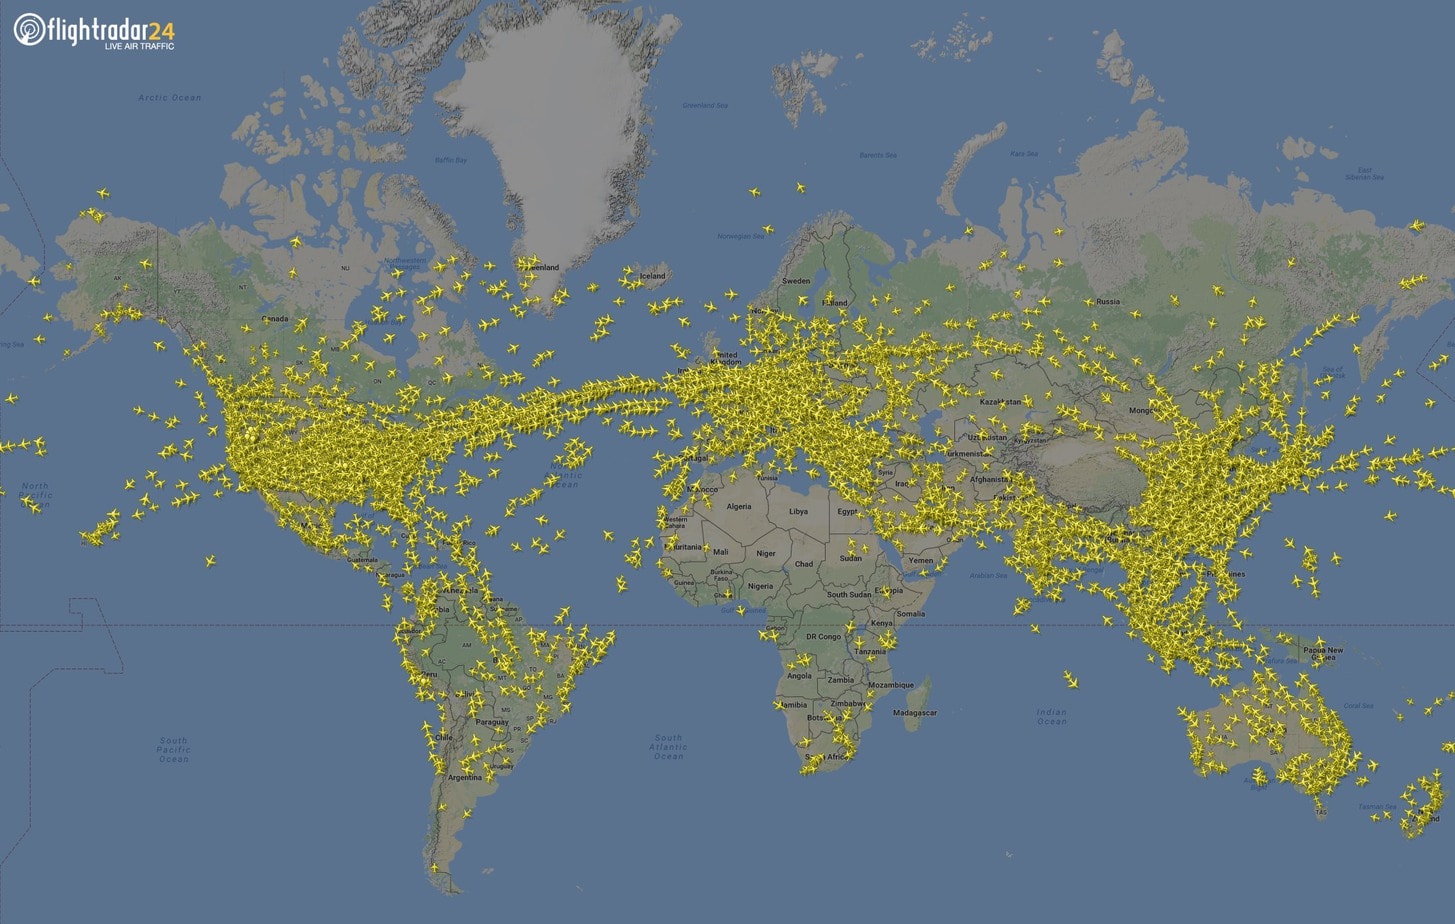
Real-Time Flights Courtesy of Flightradar24.com
Why?
Since I chose this topic, a lot of questions arose, Why? What for? Who would be interested? So these were all the answers to that.
- I wanted to know if I could answer the question “How much CO2 is polluted by aircraft without asking a single human, only with data”
- What for? Some creative purposes here:
- See the effects of the most popular destinations and their origins, how much C02 it is needed to reach some destinations, what are the main sources of these routes?
- A method to calculate in real time the cost of air incidents as unauthorized entries in controller airspace, heavy storms and winds, airports delays, etc.
- See if the new aircraft’s generation is greener than the 70 to 90s generation.
- Environmental ethics and conscience, see the figures, well or bad estimated, but just see them.
- Kioto and/or Paris Agreements established the CO2 per country, industry, etc. but in overseas flights, are the CO2 emissions well assigned to a country, industry, etc. A long-haul flight that crosses 5-6 countries keep the CO2 but they are not the origin or destination of these flights. Does it matter for somebody, International Organization or so? Could it be set a mechanism of fair CO2 trade depending on the flight’s route? Anybody is thinking about Blockchain flightCO2’s coin for trading the emissions?
- Could it be set a “Green” tax or better, a “Green” fare discount based on route congestion, efficient fleet, better CO2 per pax, etc. in airports and air routes? Could it be measured?
- Just for fun, an excuse for use technology to have answers.
THE CHALLENGE
To know in real time, or near real time, how much CO2 is polluted by the current flights, and show information derived from data.
LOOKING FOR DATASETS
I needed some real-time flights information, fuel consumptions, distances, aircraft types, CO2 estimations, weights, passengers, airports, countries… so the little data hunting began.
Real-time flights:
There a lot of commercial APIs for retrieving real-time flights with enriched information and categories as flight data, weather data, NOTAM, regulations, etc. at a cost from some dozens of euros per 10.000 requests. Sites as laminardata.aero, flightradar24.com, flightaware.com, flightstats.com, etc. have a lot of live data feeds and historical data for real business cases and almost every data for any analysis, App or operational process you might need.
But I wanted Open and Free data, probably not the best and curated data, but from a statistics perspective, it should be enough for this exercise of estimating CO2 of real-time flights. The chosen data provider was www.adsbexchange.com as others as Flightradar24 and FlightAware they have a worldwide community of participants broadcasting flight’s data with home devices receiving the signals form ADS-B aircraft’s transponders and/or MLATs and sending them to central servers to record and serve the data to others. The next picture shows my ADS-B receiver connected to a RaspberryPi.
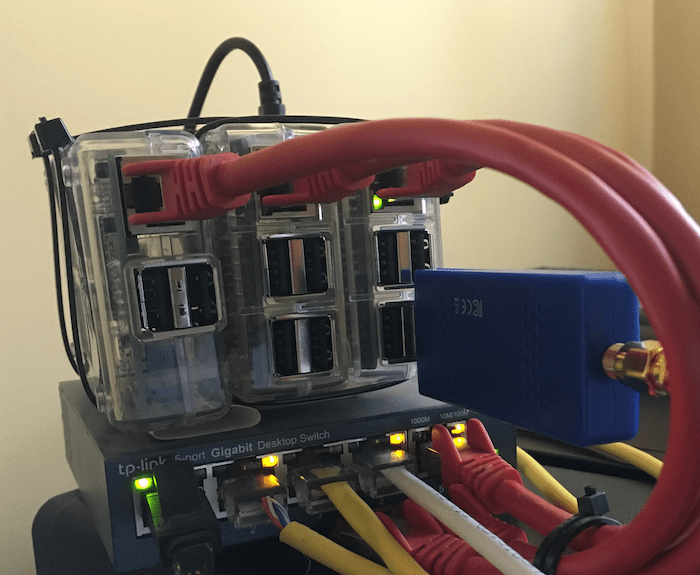
My ADS-B receiver (blue stick) connected to a RaspberryPi. Credits: Pedro Garcia – aeriaa.com
ADBSExchange has a fantastic data feeder service with several options, a typical JSON REST Web Service, CSV historical datasets, Redshift database, and you can also use the VirtualRadar Server to retrieve massive real-time data and visualize it in your desktop. Tons of MBs per second you can use for free (please donate them because maintain this is not cheap)
The data fields they provided is detailed here: https://www.adsbexchange.com/datafields/ There is a lot of interesting data, as all the coordinates taken for geo-tracking, times, static-related information as pictures, and some previously recorded data that has relation with the real-time data broadcasted by the aircraft. So, you can find several uses for all the information given.
You can retrieve real-time flights all over the world or filtered, for example by coordinates, the next pictures show the flights near Madrid in real-time. You can test it: https://public-api.adsbexchange.com/VirtualRadar/AircraftList.json?lat=40.416775&lng=-3.703790&fDstL=0&fDstU=100
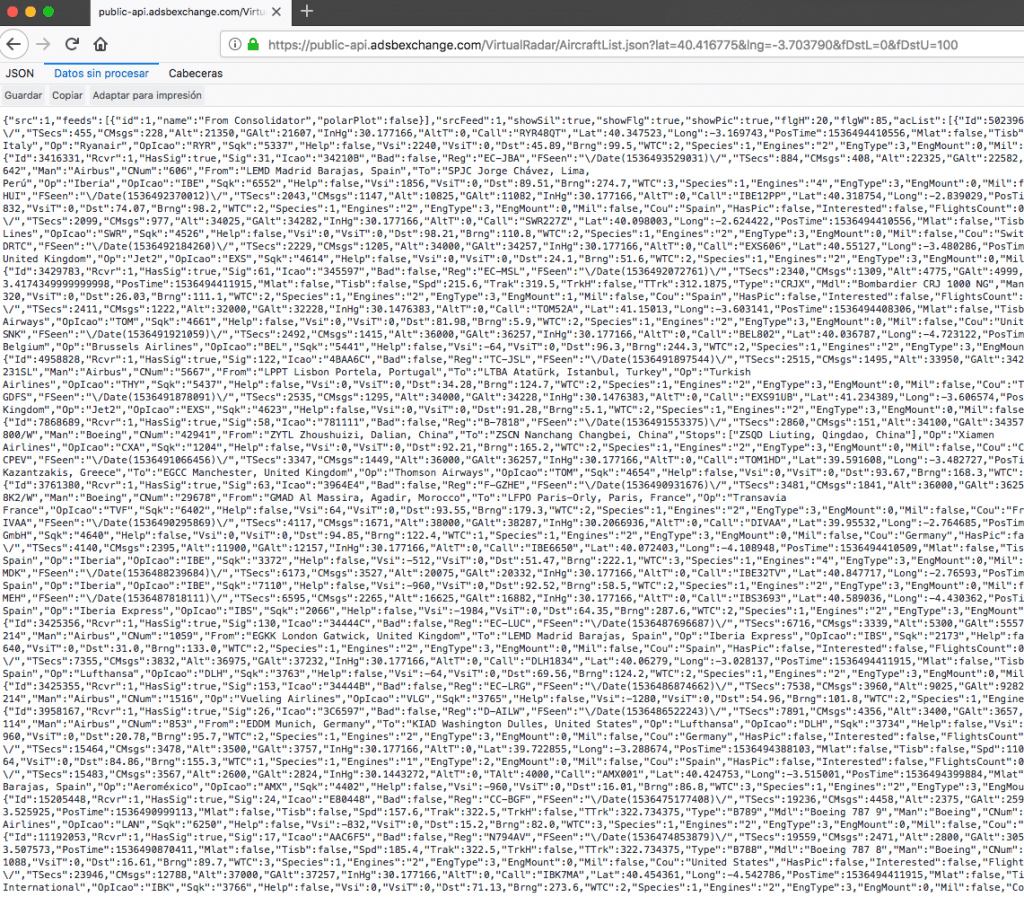
Real-Time Flights filtered by Madrid’s coordinates.
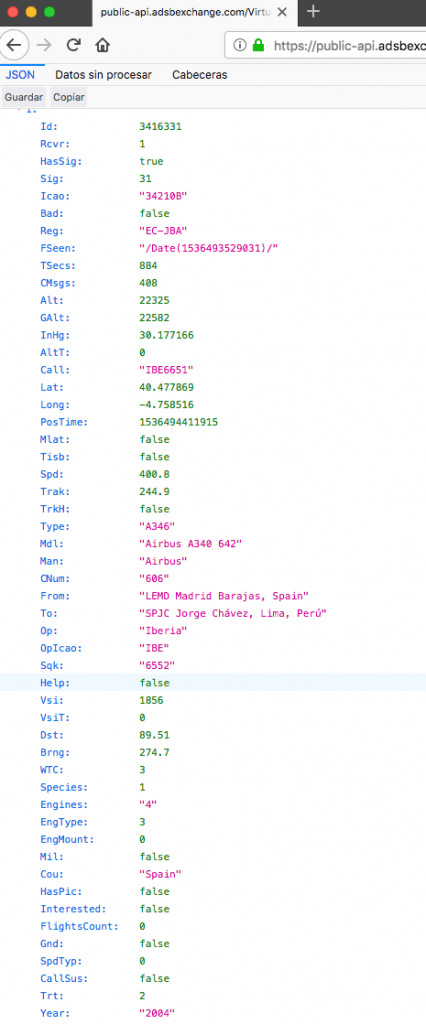
Same Real-Time Madrid Flights with JSON processed view.
How many flights are retrieved by the service in real-time? Depending on the hour, I got an average of 4.000 to 9.000 flights per request. So the real-time calculations were about 5.000 to 6.000 flights all around the world. You can test the single call for retrieving the flights all over the world: https://public-api.adsbexchange.com/VirtualRadar/AircraftList.json?trFmt=sa It will give you about 10MB of data for a single request. In this article, I used a single real-time request approach, the correct approach is calling the non-stop live data through the calls to http://pub-vrs.adsbexchange.com:32030/ this call retrieves data (for more info please read carefully its use and conditions here) Anyway, the process developed in this example can handle constant live data, it’s just a matter of storage-space and RAM memory.
CO2 and fuel estimation:
Fuel consumption:
My first contact with the idea was, how much fuel burns an aircraft, and then, how much CO2 pollutes this fuel burning? The first strategy, ask a pilot, I follow several commercial pilots in Twitter, one of them Paco Lopez (@Fjlopezm), an Iberia’s 330 Captain. I asked him to have a clue for his A330, its consumption is an average of 2.900 kg/h per engine, let’s confirm data, yes Wikipedia for everything, in this page numbers of the A330 are confirmed, the average is almost the same (6,4kg/km against 6,44Kg/km), some other data was confirmed in the manufacturer’s data and through some interesting papers as published in Hamburg University’s Professor Scholz’s website. http://library.profscholz.de (please look for the Marcus Burzlaff’s paper). Wikipedia’s website also has an interesting average number, seats per aircraft model, needed for the CO2 per pax calculations. I converted the dataset to a CSV file.
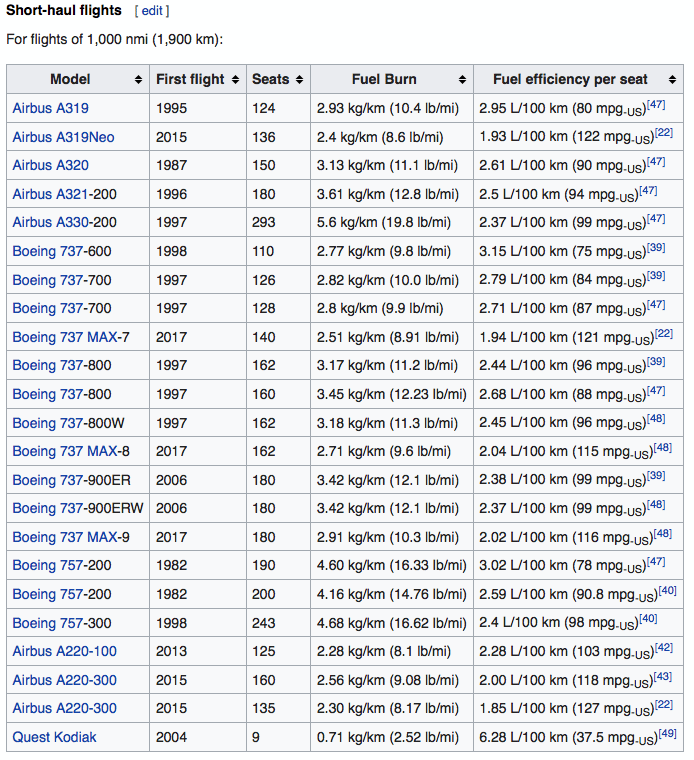
Fuel consumption. Wikipedia. https://en.wikipedia.org/wiki/Fuel_economy_in_aircraft
CO2 emissions:
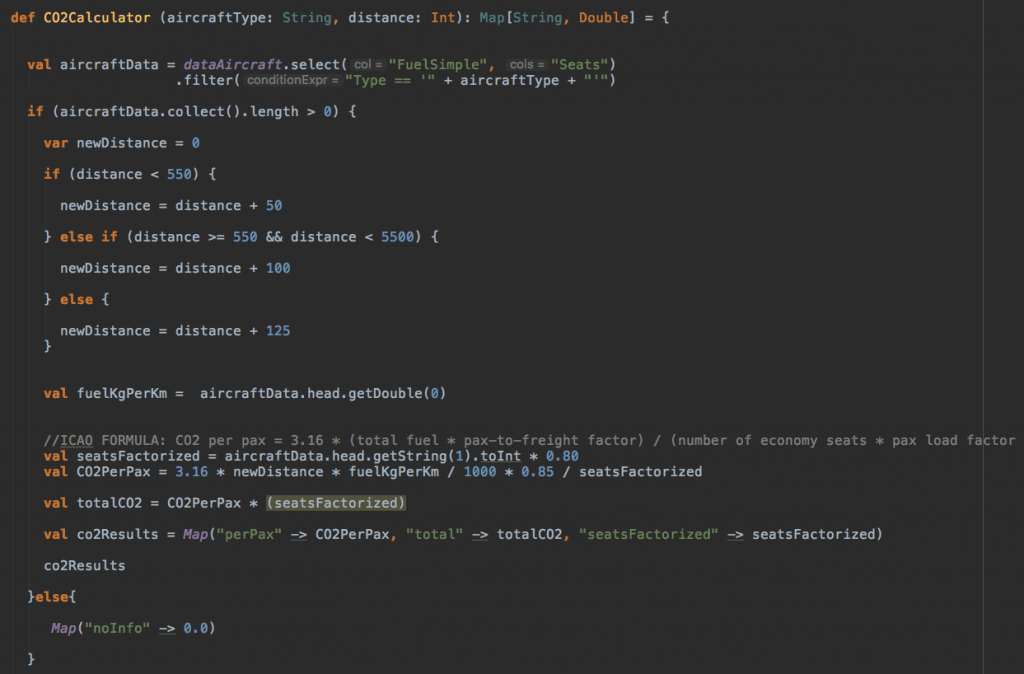
What about CO2’s emissions? According to ICAO’s (ICAO Carbon Emissions Calculator Methodology) and IATA’s facts, 3.16 tonnes of CO2 is produced by burning a tonne of aviation fuel. The ICAO’s formula is:
ICAO’s carbon emissions formula. Credits: Icao.int. Source
Reading IATA’s figures load factors, seats and cargo since 2004, I took an average of 80% pax load factor and 85% of the pax-to-freight factor. So, this is my first piece of Scala code, looks like this.
Scala code based on ICAO carbon emissions. www.aeriaa.com
Do not miss the ICAO’s Carbon Emissions Calculator
Distances:
The Great Circle Distance came to rescue, a lot of geo libraries and examples are out there, but the simplest solution came from this Java’s code from Robert Sedgewick and Kevin Wayne. But I added the ICAO’s recommendation of a correction factor for the distances (not shown in the following piece of code).
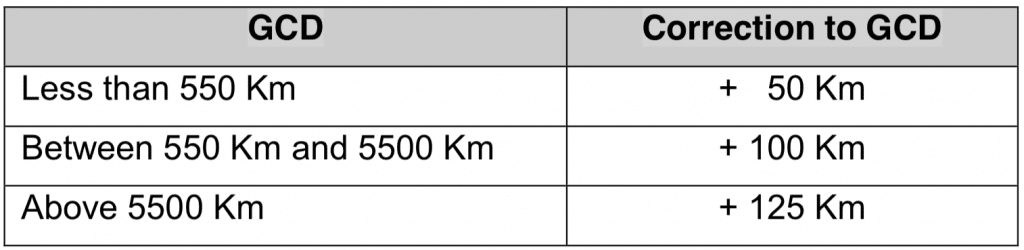
ICAO’s correction factor for Great Circle Distance
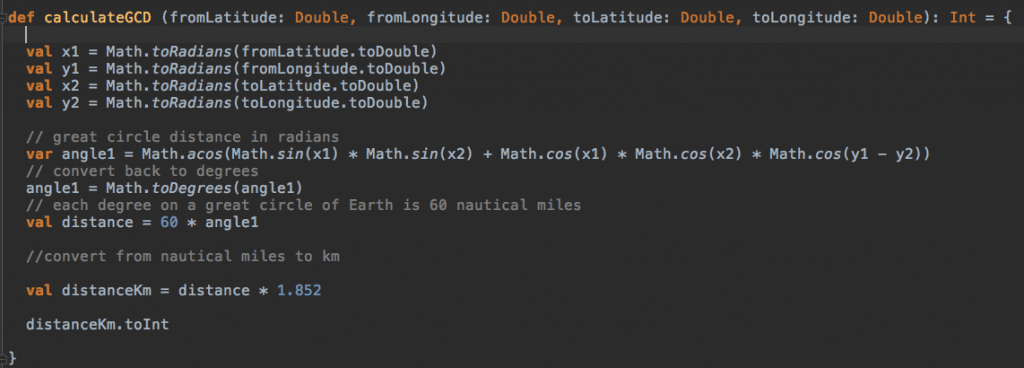
Great Circle Distance between two coordinates. Scala code ported from Robert Sedgewick and Kevin Wayne Java’s code.
My first GCD calculations were also confirmed by this great website GreatCircleMapper.net.
Great Circle Distance from London to New York. https://www.greatcirclemapper.net/
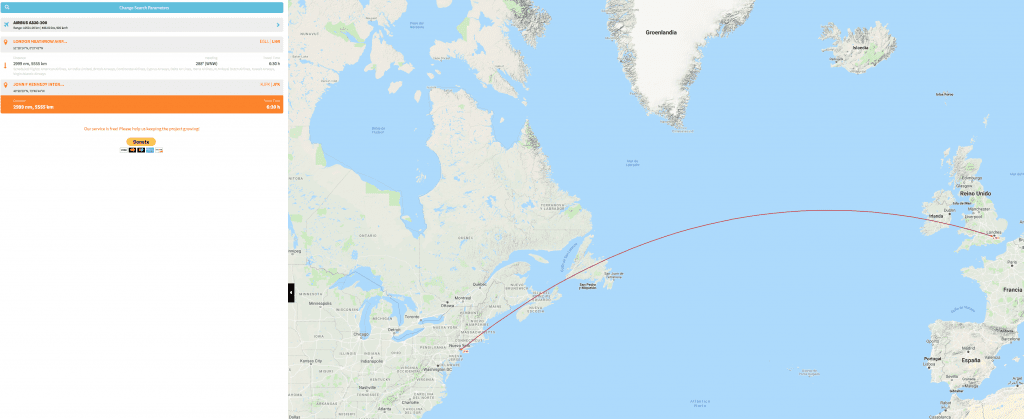
To calculate the GCD I need the airport’s coordinates, there are a plenty of datasets, I took this one from ourairports.com where the dataset has: coordinates, IATA and ICAO codes, countries, regions, name, airport’s size, etc. of 54.500 airports all over the world.
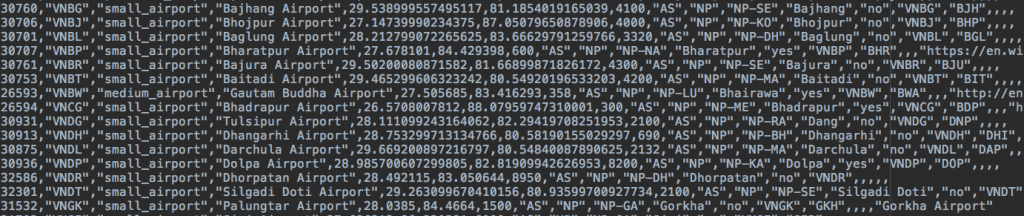
Airports dataset. Source: OurAirports.com
And finally, some ISO Countries datasets fitted well for some geo analysis with the carbon emissions.
So, to sum up, the real-time analysis I used:
- Real-time flight’s feed API.
- Most commons Aircraft’s fuel consumptions and average seats dataset.
- World airports with its coordinates dataset.
- ISO Countries dataset.
The technological stack
Let’s play with data. The stack used for this little project is composed by:
- Apache Spark. It is a computing engine and libraries for parallel data processing on computing clusters. (Source: Spark: The Definitive Guide. Bill Chambers & Matei Zaharia. O’Reilly).
- Scala language.
- Apache Kafka. As a streaming platform for processing, publish and subscribe data in real time.
- Microsoft Power BI. For visualizing data processed. As I’m also learning Tableau, I just put a simple example.
- API REST for collecting data.
As this project is just a little demonstrator of the Big Data’s Stack, I have to mention that obviously other elements should be present, but for simplifying the article I’ve not use, these components are:
- Apache Hadoop, for distributing the massive data, in my case I do not have massive data, if I put others features in the real-time processing apart from CO2 exercise, as geolocalization, real-time scheduling, other complex calculations and higher amounts of data, Hadoop basic for this challenge.
- Reactive Architecture, a variation of this article could be implemented in a Reactive Architecture way, like Akka, for adding more concurrency, scalability and preparing the architecture for other modules that take part from the real-time flight information, creating more services, serving data and/or information to clients applications, sinking information into Datalakes, etc.
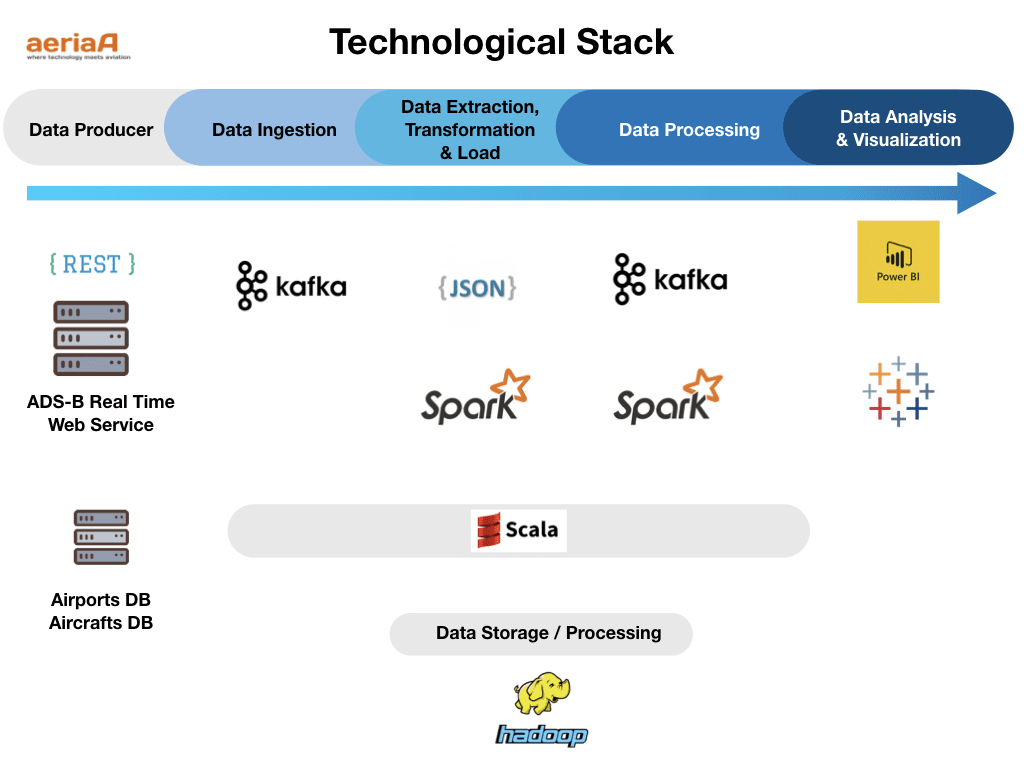
Technological Stack used (Hadoop is optional in this POC) www.aeriaa.com
The Big Data process
The process of the data processing is shown in the next picture:
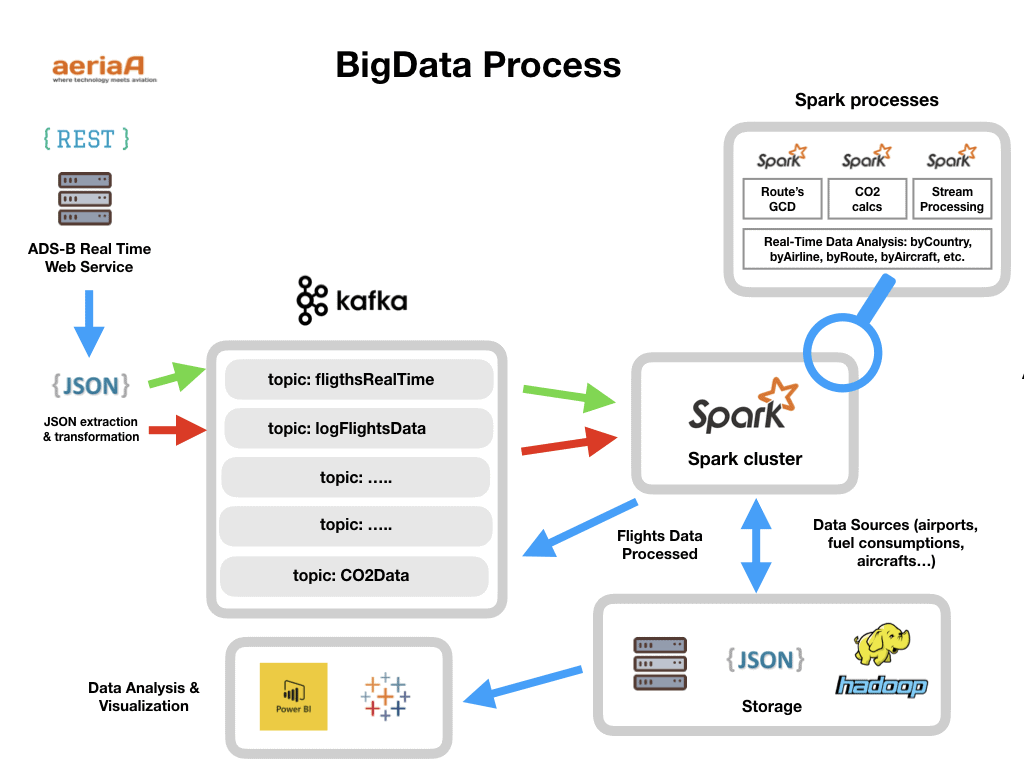
Big Data Process for CO2 Analysis in Real-Time. www.aeriaa.com
Data, in JSON format, is served by the ADS-B Web Service and collected by a Scala Object that splits the flights’ data in order to send, first to the flightsRealTime channel, the fields that are needed by the CO2 calculation and analysis, and to a second channel, with all the information to logFlightsData. The data sent to the second channel is stored in files, JSON and/or Hadoop for further uses and analysis (we can use it for batch processing, for analyzing other business cases as delays, routes, paths/waypoints, aircraft fleets, speeds, altitudes, etc.)
The data is ingested in the Spark cluster, and several processes execute all the “magic” of CO2 calculations.
- The GCD of the flight’s route.
- The CO2 estimation.
- The stream processing processes to ingest/sink all the data.
- And all the analysis derived from the data ingestion, analyze the Co2:
- by Aircraft’s type.
- by Airline.
- by Country of origin or destination.
- by Route / Airport of origin/destination.
- by long / medium / local routes.
Spark processes use all the data sources, querying, aggregating, joining and filtering form all of them, Kafka streams, airports/coordinates/countries, aircraft/fuel consumptions databases. So the power of the Spark architecture resides in the multiple nodes that can process the data, the fast in-memory SparkSQL/RDD processing, etc.
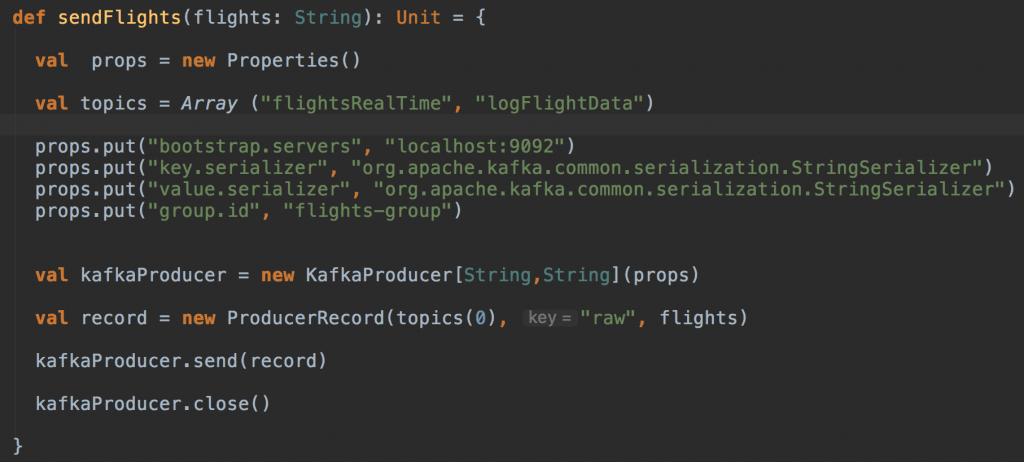
Sending flights data to Kafka. www.aeriaa.com
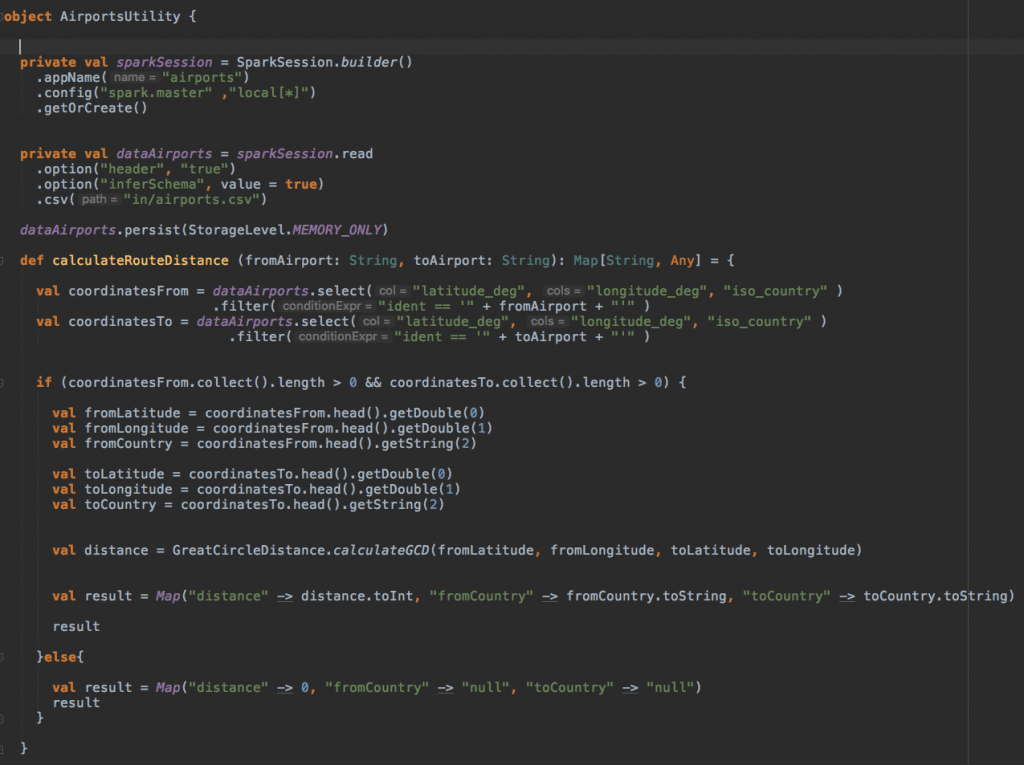
Calculating the route’s distance between airports. The ICAO’s correction factor is applied in the CO2 calculations. www.aeriaa.com
CO2 calculator. www.aeriaa.com
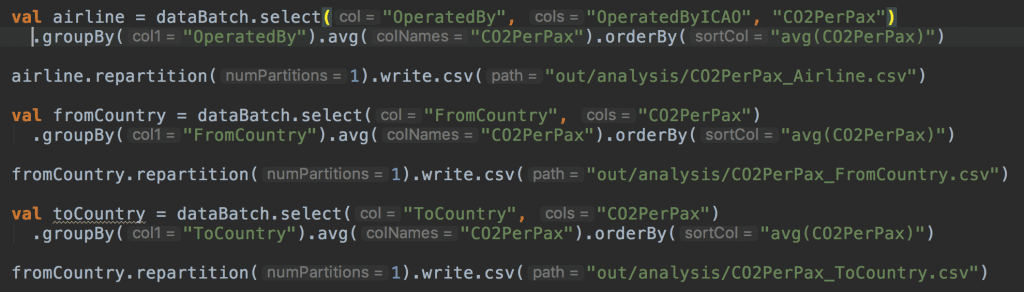
Analyzing CO2 results by other dimensions (airlines, countries, etc.). www.aeriaa.com
The following video shows the real-time processing.
visualizing and analyzing data
As mentioned before the data is analyzed in several dimensions, CO2 by aircraft’s type, by airline, by country origin/destination, airports, routes, etc. The results of these analyses are visualized in Power BI, let’s see some of the dashboards developed.
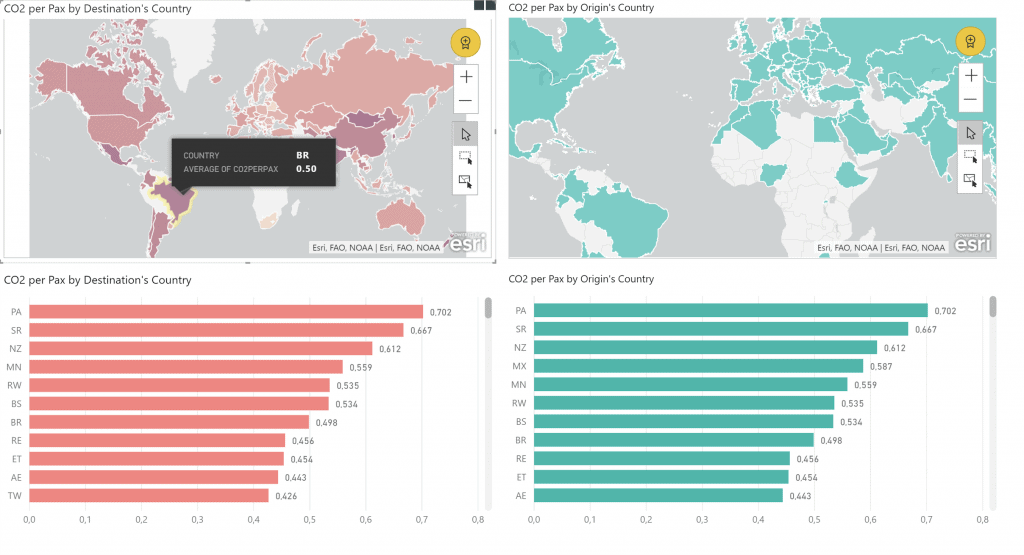
CO2 By country of origin and destination. www.aeriaa.com
In the data collected, at this very moment, Panama was the country with the worst CO2 indicators, 0,702 ton per passenger for flying to/from it. Remember this data represents the real-time flights collected in a certain time.
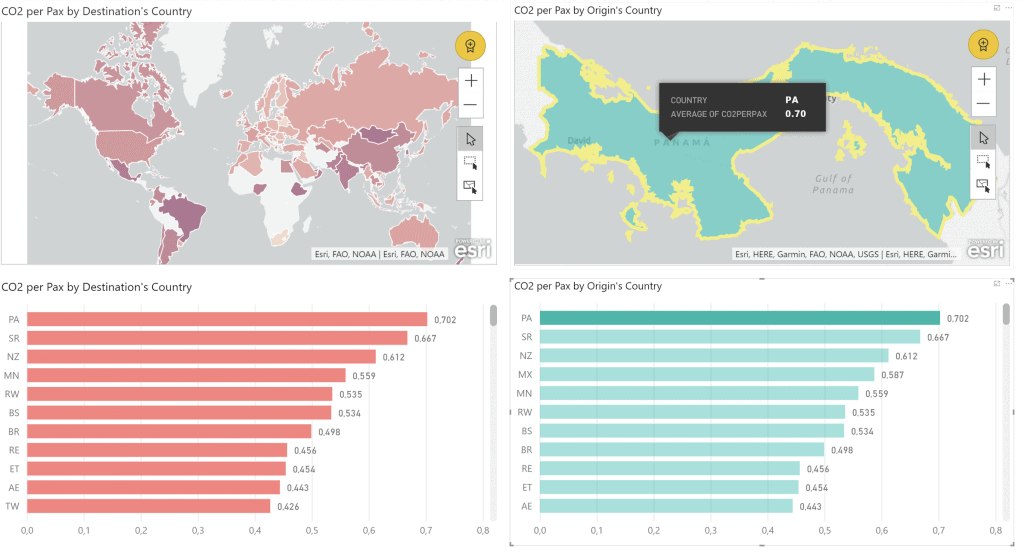
CO2 estimations for Panama as Flight’s Origin. www.aeriaa.com
The following dashboard shows the Average CO2 per pax estimated for long, medium and short routes. Looks like London to Sydney, in a flight operated by Qantas in Airbus 380, and 17.009 km long flight gives a result of 1,51 ton per passenger. In medium routes, a flight operated by Jetblue covering the route from Boston to Austin in an Embraer 190 gives 0,29 ton per pax. On the other hand, the short routes data is filtered by the greener flight, and two flights are the winners, very short flights of 130 km (737-9 MAX between Orlando and Tampa, USA) and a 180Km long flight between Ibiza and Alicante, Spain, has a rounded 0,01 ton per pax.
In the below maps, NTAA (Tahití) airport is the destination with the worst CO2 per pax, about 1,4 ton, and by origin VAAH – Sardar Vallabhbhai Patel, India, is the worst by origin, getting out of VAAH costs almost 0,9 ton per pax.
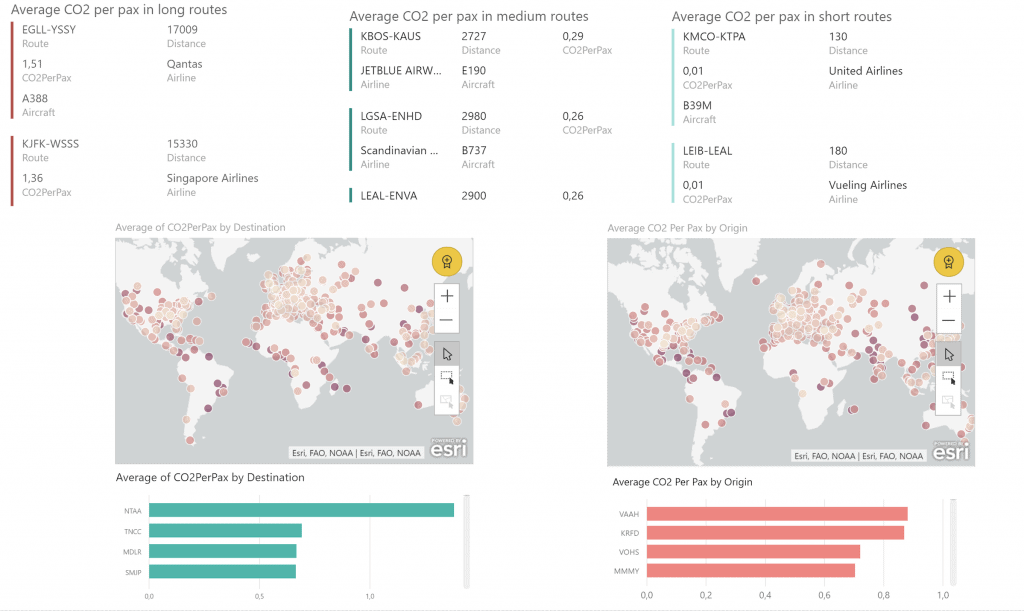
CO2 by Routes. www.aeriaa.com
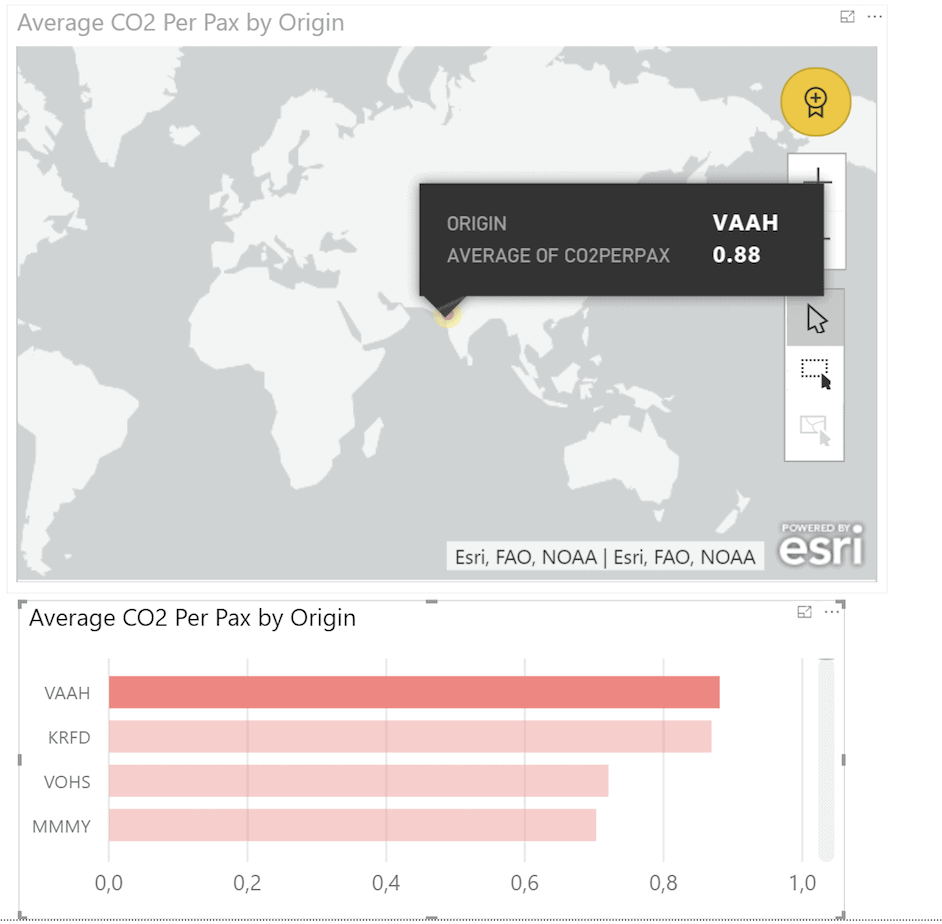
VAAH airport ‘s flight average CO2 emissions as origin airport. www.aeriaa.com
A final dashboard showing CO2 estimations by aircraft’s types and airlines.
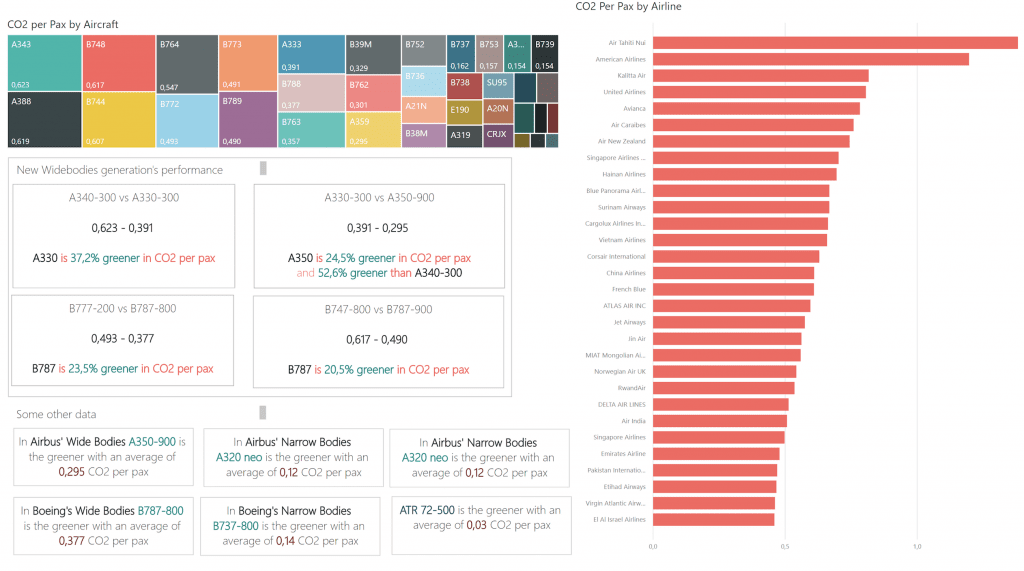
CO2 estimations by Aircraft’s type and airlines. www.aeriaa.com
The average CO2 per pax and aircraft, based in the routes gathered, shows that the A340-300, with 0,623 ton per pax is the most polluting aircraft chased by B747-800 and A380, the ATR 72-500 with 0,03 ton per pax is the greener, obviously, its routes are shortest.
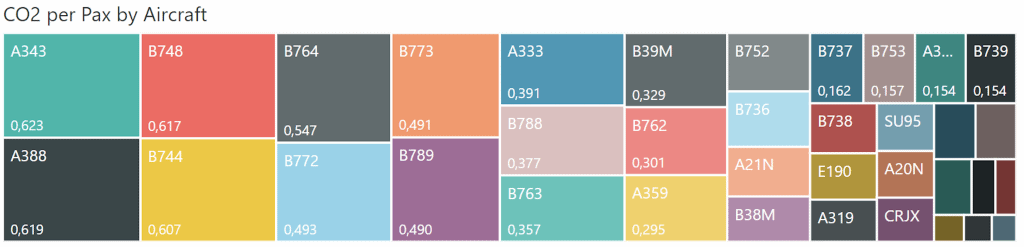
Treemap with the CO2 emissions by Aircraft type and per pax, based on its route’s distance. www.aeriaa.com
But the interesting thing is how behaves the new aircraft’s generations, and the results are clear.
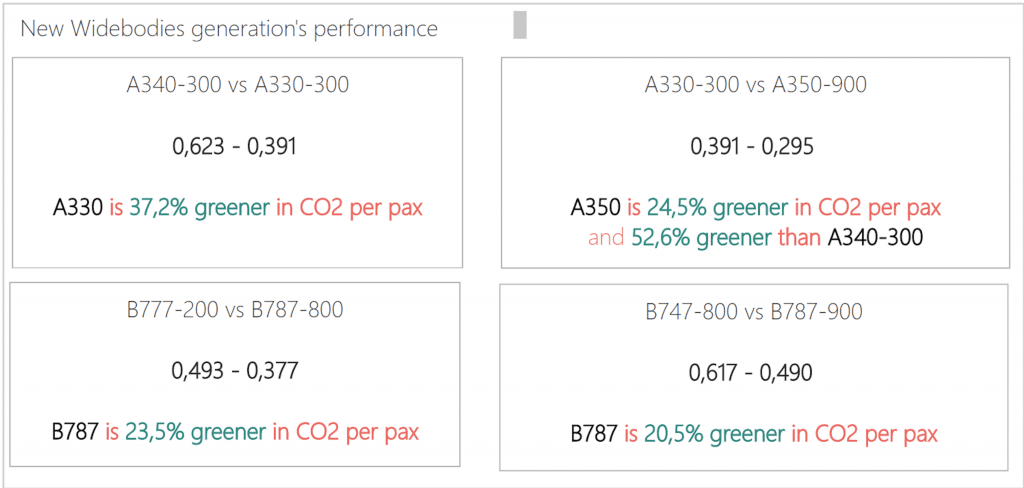
Widebodies CO2 performance per pax and route’s distance. www.aeriaa.com
Some other data extracted from the real-time information shows Which Airbus and Boeing are the greenest.
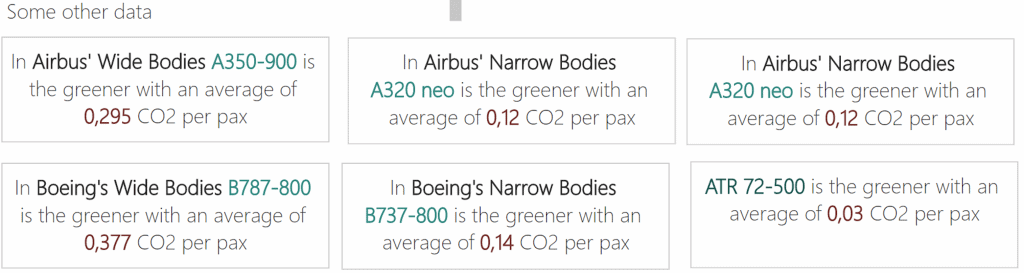
Airbus and Boeing numbers, CO2 per pax and by route’s distance. And the ATR numbers mentioned before. www.aeriaa.com
Finally, the airlines, the most polluting airline, got in this data streaming is. Air Tahiti Nui and the greenest is the regional FlyBe.
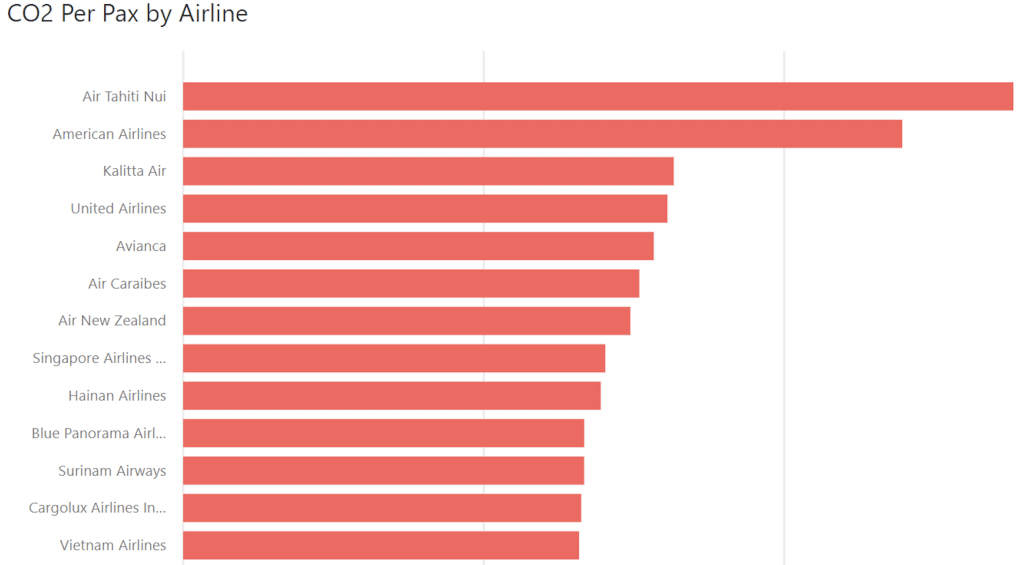
Top polluting airlines determined by its route’s distance. www.aeriaa.com
The greenest are:
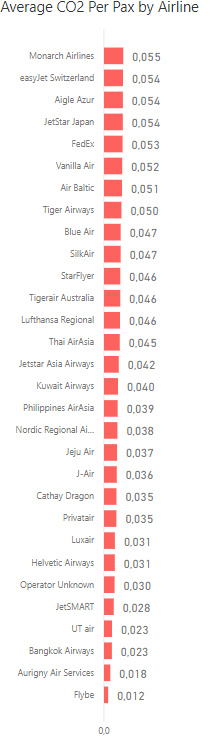
Greenest airlines on the list. www.aeriaa.com
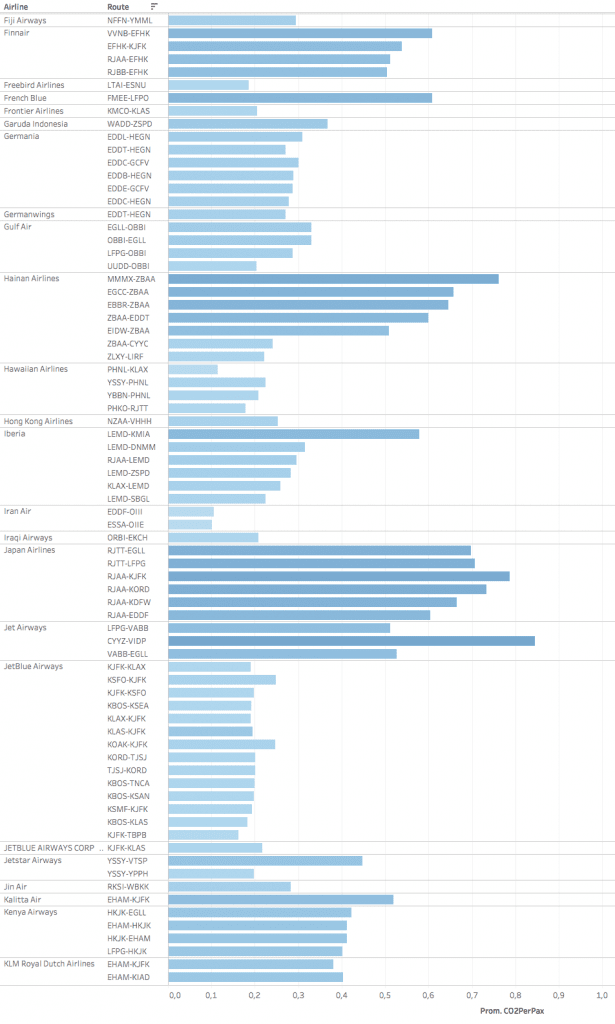
The next graphic is developed with Tableau, just for pure exercise, shows the CO2 per pax, per route and airline.
next steps. CO2Coin, a blockchain for emissions allowances.
As mentioned before this is just a playground real-time calculations, a far beyond project will be to implement in real time the CORSIA programme by ICAO, more info a few lines below, and implement a real-time reporting CO2 calculations by airlines to the system and tokenize the CO2 exchange value in order to deploy sustainable measures for balancing out the pollution. As an idea for tracking all these processes and being transparent from the carbon emissions rights issued by every single pax and how the rights convert in a real sustainable measure, we have blockchain for that. You can see the article I published some months ago about the Passenger Journey tracked by a Blockchain. The newness is to implement something like this.
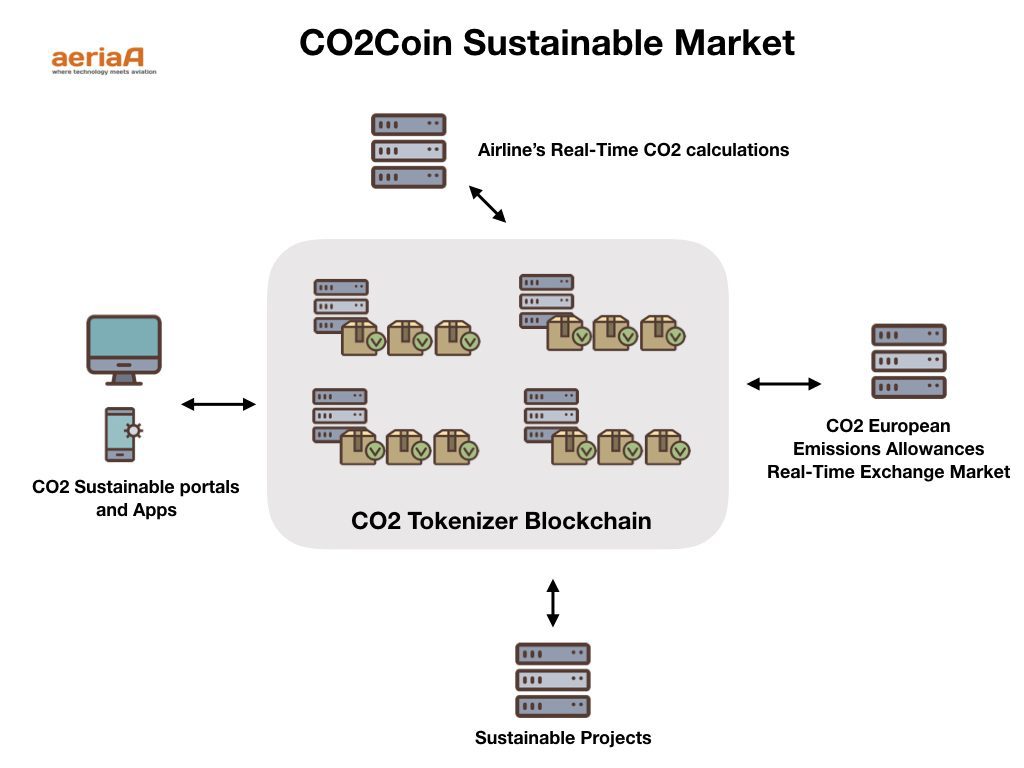
CO2 Sustainable Tokens market. www.aeriaa.com
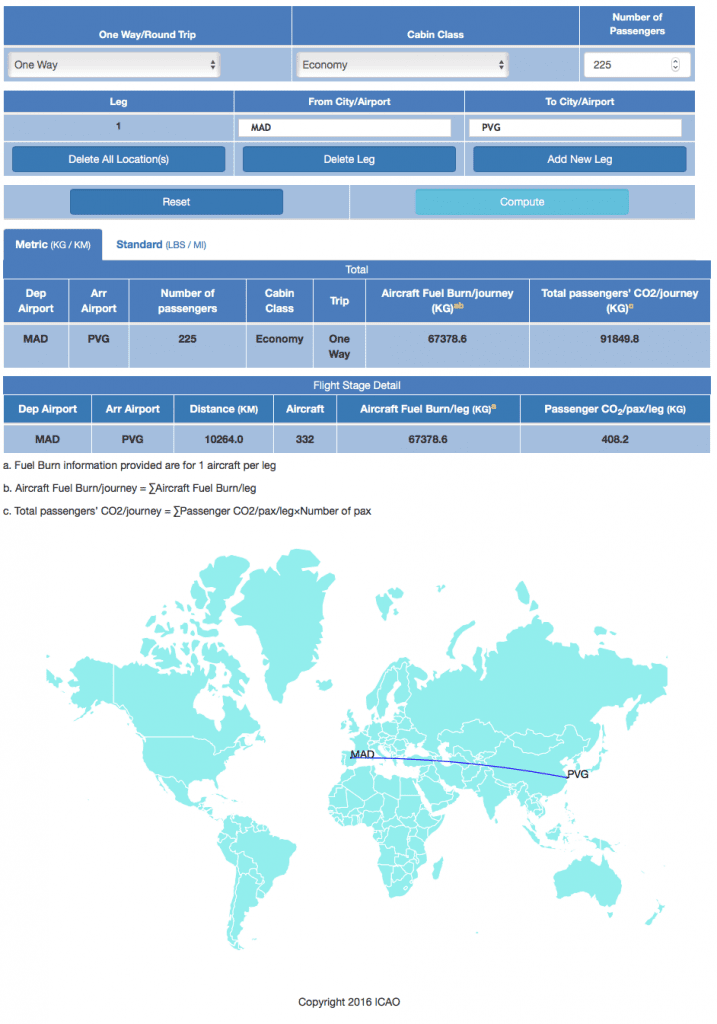
By the way, CO2 European Emissions Allowances rose last year from 7€ per tonne to 20€ (September 2018). So, a flight, operated by an A330, from Madrid to Shangai emits 91.5 tonnes of CO2 or 0.41 tonne per passenger, according to CO2 market, this flight should have a cost of 640€ (2,85€ per pax), and now, in September 2018 the cost is 1.830€ (8,2€ per pax), crossing several countries. Did you remember the idea in the “Why” section about a fair trade? What if a CarbonCoin issued in real-time as the flight crosses every country with these costs and distribute it among actors/airlines/countries?
extra info.
Extra info 1. CORSIA.
The international community recently adopted ICAO’s transformational Carbon Offsetting and Reduction Scheme for International Aviation (CORSIA), a major plank in the UN agency’s environmental protection strategy. Watch this video to understand what it is and how it works. Credits Source: ICAO’s Youtube Channel
Extra info 2: Costs of fuel consumptions in air incidents.
As I told in the “Why?” section, this real-time calculation would be suitable for estimating the costs of air incidents as unauthorized entries in controller airspace, heavy storms and winds, airports delays, etc. An example of this is the NATS statement of every year 1000 infringements in air controlled space occurred at a cost of more £50.000 in fuel burn, delays, etc.
Extra info 3: Environmental trends in aviation to 2050 and Clean Sky EU Programme.
In the first paragraph of this article, we mentioned the 2050’s goals of greenhouse gas reductions. There is an excellent report published by ICAO, authored by Gregg G. Flemming and Urs Ziegler, Environmental Trends in Aviation to 2050. I would like to extract some figures and statements. All credits are from its authors and ICAO.
“The next table summirizes the nine full-flight fuel burn and CO2 emmissions scenarios developed for the assestments of trends for aircraft emmissions that affect global climate”
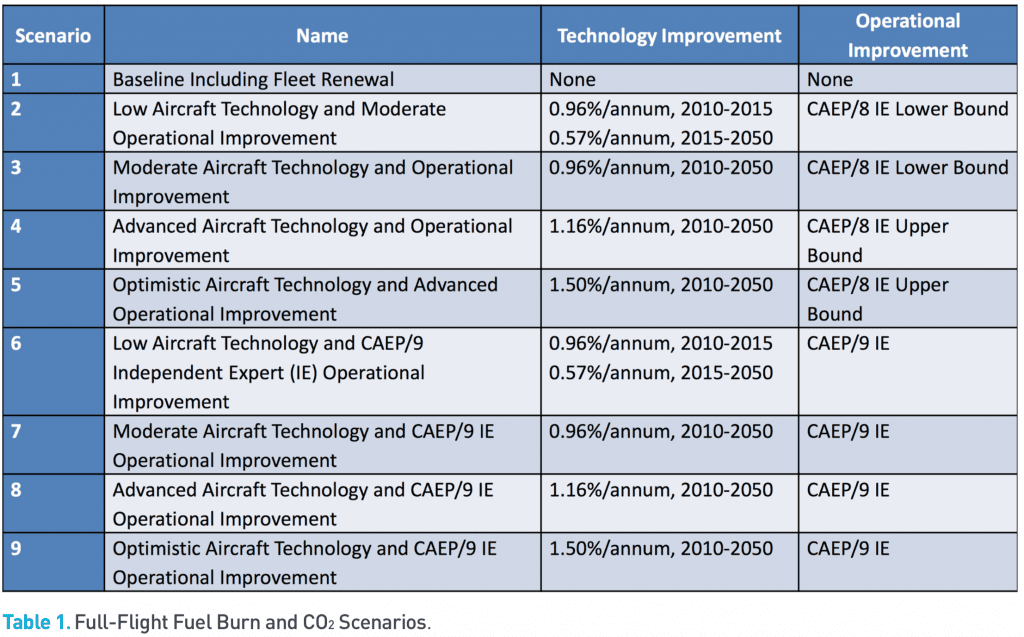
Credits: ICAO. Source: ICAO Environmental Report
The next figure “represents full-flight CO2 emissions for international aviation from 2005 to 2040, and then extrapolated to 2050. This figure only considers the CO2 emissions associated with the combustion of jet fuel, assuming that 1 kg of jet fuel burned generates 3.16 kg of CO2. As with the fuel burn analysis, this analysis considers the contribution of aircraft technology, improved air traffic management and infrastructure use (i.e., operational improvements). In addition, the range of possible CO2 emissions in 2020 is displayed for reference to the global aspirational goal of keeping the net CO2 emissions at this level. Although not displayed in a separate figure, the demand uncertainty effect on the fuel burn calculations shown in Figure 2 has an identical effect on the CO2 results. Based on the maximum anticipated fuel consumption in 2020 (Scenario 1) and the anticipated Scenario 9 fuel consumption in 2040, a minimum CO2 emission gap of 523 Mt is projected in 2040. Extrapolating Scenario 9 to 2050 results in a 1,039 Mt gap.” Source: ICAO Environmental Report
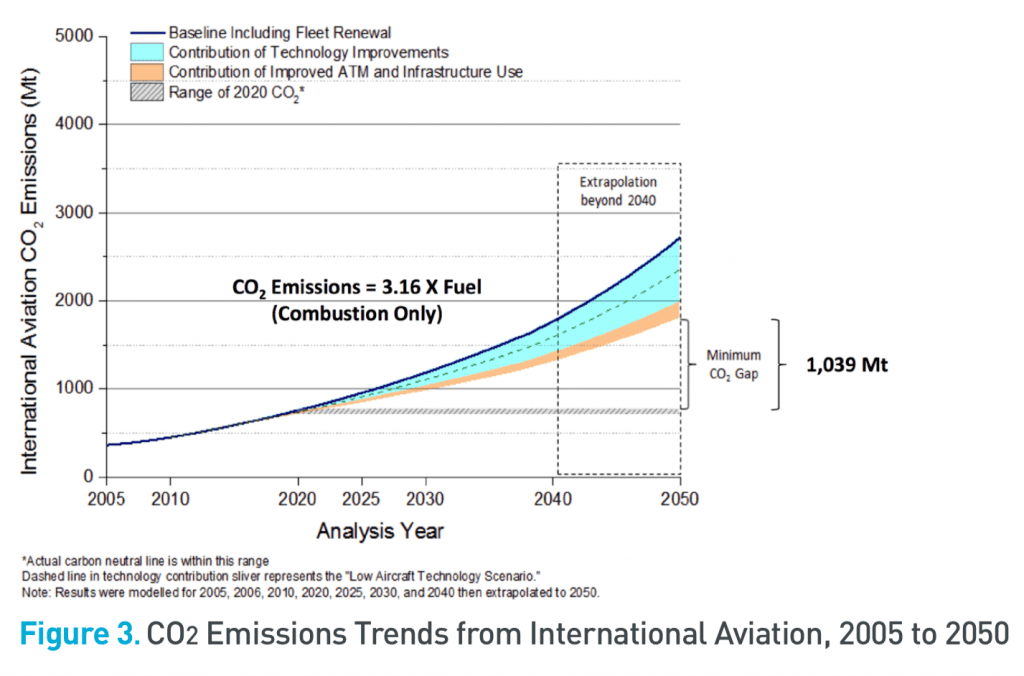
Credits: ICAO. Source: ICAO Environmental Report
The next infographics sums up the initiatives of the Clean Sky Programme part of the Horizon 2020 programme.

Source: Clean Sky Programme
For more info:
Transatlantic airline fuel efficiency ranking, 2014 Irene Kwan and Daniel Rutherford
