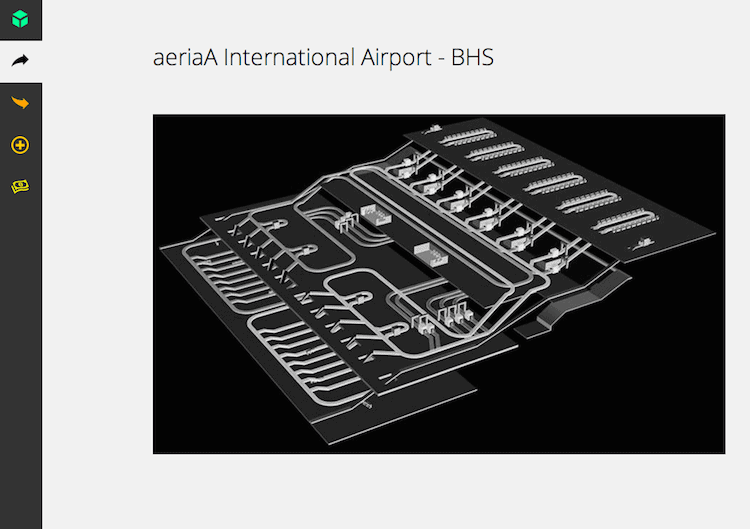
In the previous article we started to develop the basic airport’s systems four our Airport Dashboard’s Project, the AODB mock-up, in this article we are going to build another airport’s system mock-up that has a relationship with the AODB, the Baggage Handling System (BHS), not the physical system but the Sort Allocation Computer (SAC). Please see this article for a introduction of the AODB & BHS relationship. To sum up, the BHS has the following main features.
- Transport, classify and deliver each baggage to its destination carrousel (departure and arrival flights).
- Process the baggages in the integrated security subsystem. As X-Ray machines that look for hazardous substances, material, drugs, explosives, etc.
- Store the baggages for early check-in flights.
What data do we want from BHS to our Dashboard?
- General process status and metrics. Bags per hour, first bag delivery time, luggage events per flight, bad reading tag ratio, system status, percentage of manual sorting in comparison to automatic sorting, percentage of bags that are wrongly sorted by the system (sent to a wrong carrousel), average time and standard deviation regarding the time to be sorted by the BHS, etc. Thanks Pablo Roux for some KPI’s suggestions.
What data does the BHS (SAC) need from the AODB?
- The flights scheduled for a time period (day, week, etc.). Where are they planned to be parked.
- Any flight’s relevant updating in real time, any new estimated time of arrival or departure (ETA, ETD), cancellation, stand reassignment, etc.
Are there other systems closely related to BHS?
- Yes, the Airlines Departure Control Systems from the BHS will be notified about the baggage checked, through SITA. (see the article mentioned before)
So, after the introduction, let’s start to develop the BHS (SAC component). In this mock-up the SAC component will have these main features:
- It will manage the departure’s belt/carrousel assignment. It will be done by a simple proximity algorithm (only for the mock-up’s simplicity), the carrousel will be the closest to the expected flight’s stand. But I received a lot of comments in LinkedIn groups for being more “pro”. You are thanked at the end of this article. So I will also implement the Ground Handler Assignment criteria, Ground Handlers have specific Carrousels.
- It will manage the flight data, load the flight’s schedule and update any flight that affects to the belt/carrousel assignments.
- It will show visually the daily schedule and its status during the day.
- It will manage the BSMs type messages sent by the airlines through SITA. (Sorry Jonathan for the simplicity of this first demo iteration we’ll implement a direct interface between SITA and the BHS, but below we include your proposal).
- It will manage the general statistics and status of the system, these numbers will be exploited by the Airport’s Dashboard.
In this first BHS article I’m going to implement partially 3 of these 5 points. Carrousel’s assignments, flight’s load and the daily schedule representation.
The BHS (SAC) Architecture
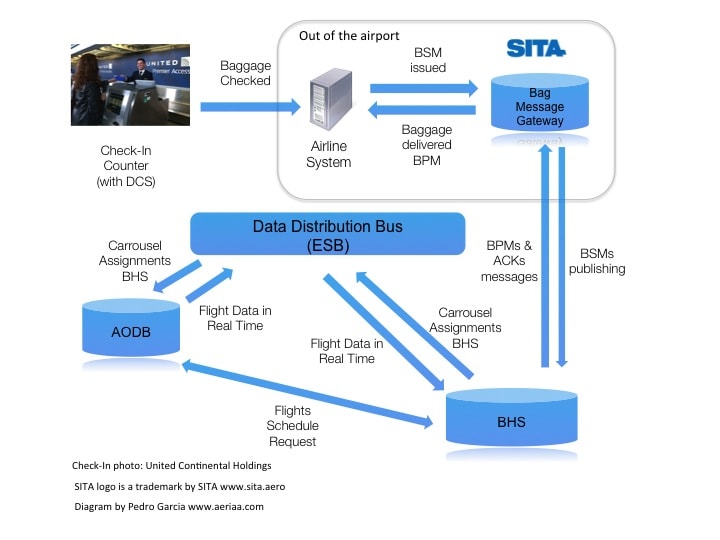
In this point, we recover here the architecture diagram shown in the AODB & BHS post with some modifications.
We decided to put a direct interface based on Request/Response paradigm between the BHS and the AODB for the Flights Schedule data. We want to use the AODB’s Web Service already developed in the last article so as to retrieve the flights. We will use the findAllDepartureFlights method to get the data.
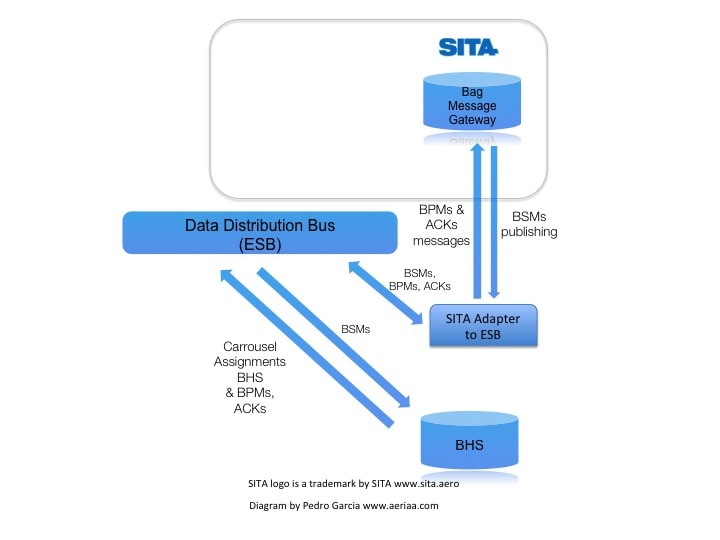
We have a second partial version with a suggestion made by one of our readers, thanks Jonathan, he suggested to use also the ESB as the distributor of the BSMs messages, so we could connect SITA to the airport’s ESB (via an adaptor). He considered that in big airports (Hub airports) this is in an integration advantage for transferred bags. So, we have made this second version for this part of the architecture.
As you see we introduce here the ESB component (named as Data Distribution Bus), we can use any Open Source ESB available, ActiveMQ, RabbitMQ, even Mule, all of them implement the basic paradigms and they all have libraries for the most extended programming languages. During this demo we already use Java (with ActiveMQ) in the Logger component with Splunk, but in this post we will use other, RabbitMQ, this is still a mock-up and we can keep testing several options.
The following diagram shows the component architecture of the BHS (SAC) mock-up, if you want to know more about the technologies mentioned see the AODB post (Technologies Used Chapter).
Both apps, AODB and BHS, implements the connection to the ESB, in this first step based on a Publish/Subscribe paradigm, the AODB will listen messages about Carrousels Assignments sent by the BHS to the ESB.
The App
We’ve taken the same App ideas of the AODB, a simple menu on the left and different HTML5 files for each functionality, in this article we implemented the Home Screen (next figure) and the Scheduled Flights and their carrousels assigned screen.
Assigning Carrousels to Flights
For assigning the carrousels to flights we need first the flights charged in the BHS, for that we call the AOBD Web Service that provides this information.
So, we have the departure’s flights, we store them at the database and then we can start the carrousel’s assignment. We set a -3 hours to -15 mins range for the carrousel’s assignment (the early checkin luggage will have its own range, but not now). In a MongoDB’s collection (bhsCarrouselsByProximity) we have the closest carrousels for each gate then we search for each flight its closest carrousel, then we can update the database with the new assignment and also send it, as a message, to the ESB, the message could be subscribed by any system connected to the ESB, in this case the AODB.
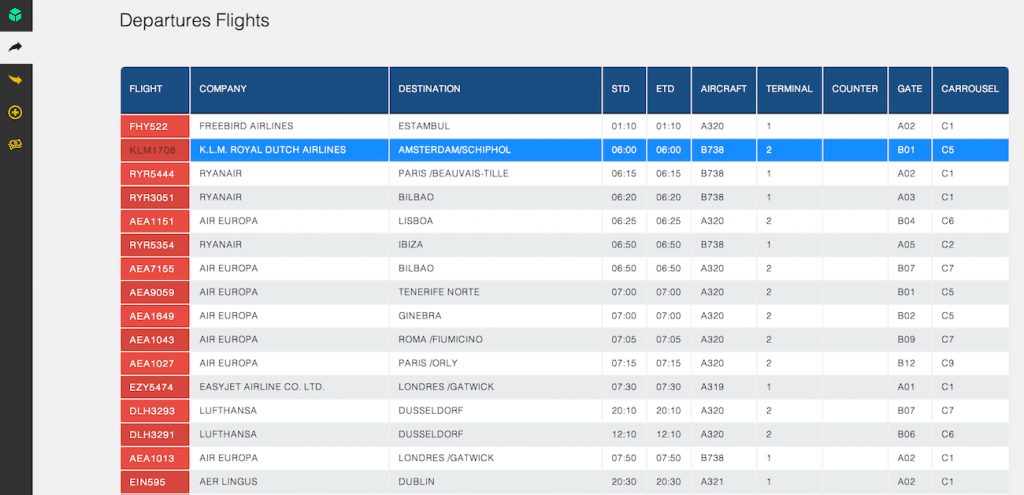
The next picture shows the AODB’s Departures Flights screen with the Carrousel updated. By the way, we do a bit of CSS and redesign this page. (a little bit different from the previous one).
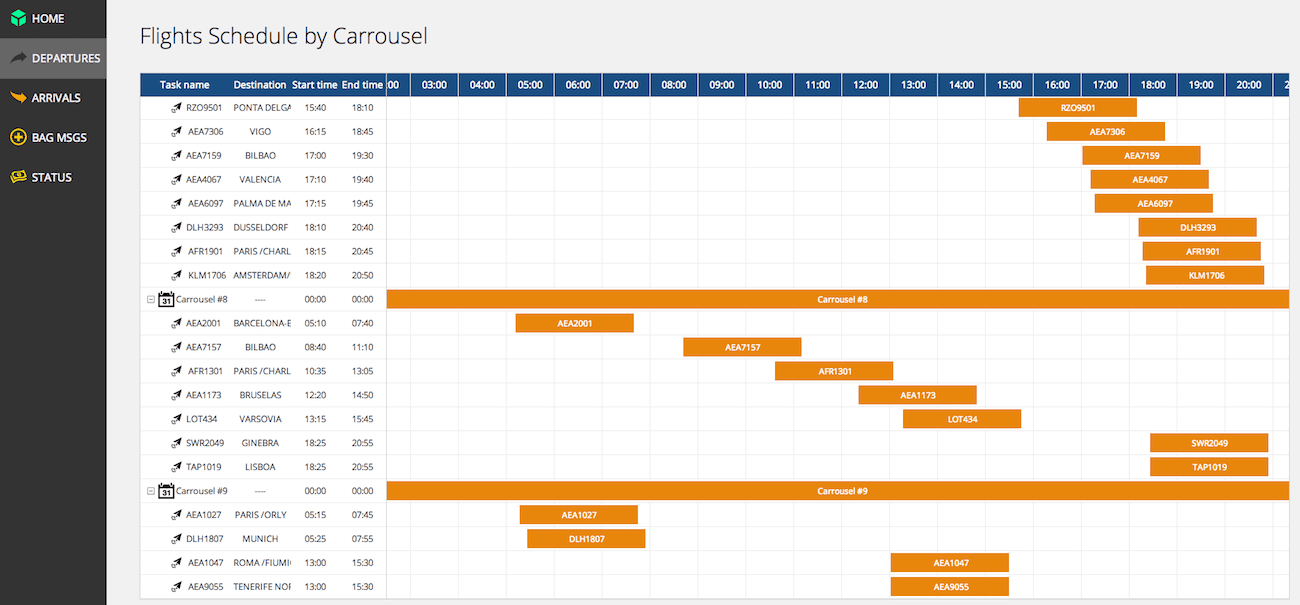
We are ready now for representing the assignment in a graphical way. First, we create a JSON file with the assignment for each flight, this file will be read by the webpage that will show this data. We sorted the data by Carrousel and by Estimated Time of Departure.
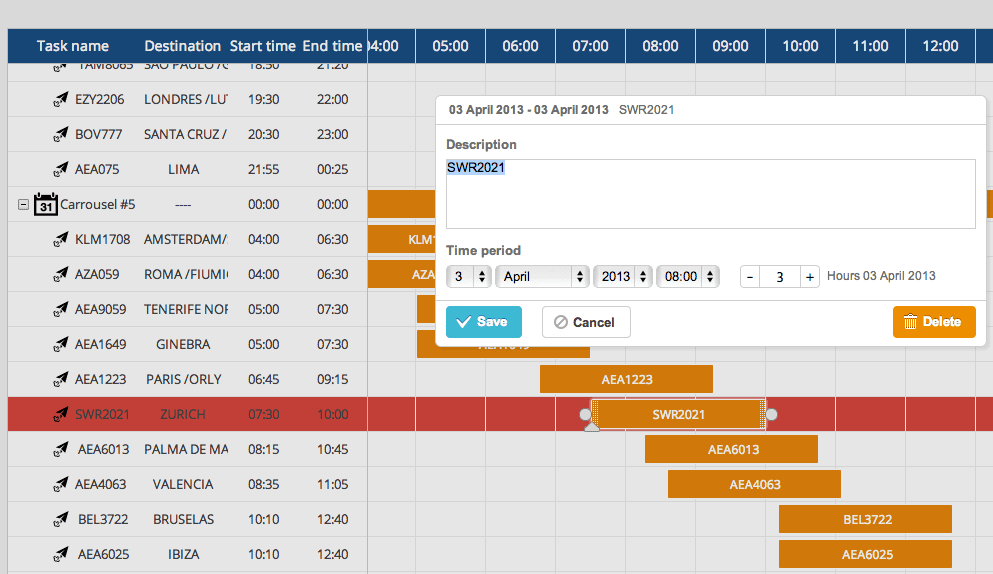
Et voilá, we have a nice representation for each carrousels and the flights assigned to them. The bars represent each flight with its flight code and its width represents the assigned time (-3 hours to -15 mins range). You can click on the image for further detail.
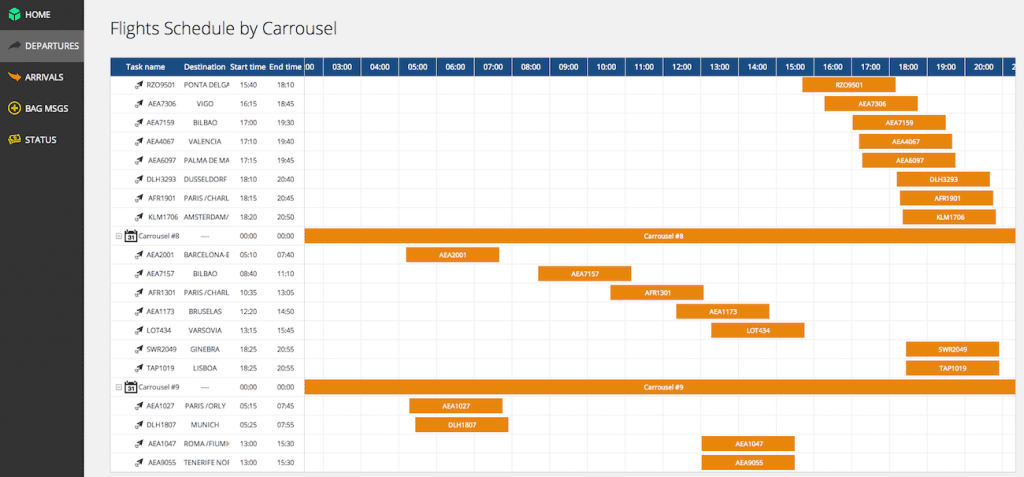
Flights Schedule by Carrousel
We can also select a flight and change the assignment time extending/decreasing the bar or in the specific screen shown below, delete manually the flight or change its flight’s code.
I just want to remember you that these airport systems’ mock-ups are being developed for feeding an Airport’s Dashboard, but they will be improved in further iterations for having more functionalities.
Finally, I would like to thank the comments made by several people at LinkedIn groups, I specially like to thank Pablo Roux, Ignacio Fernández-Cuenca, Morteza Moghisy, Jonathan Prizeman, Andrew Price, Domien Heremans, Bruce Kellar, Ricardo Sferco, Les Hawkey, Chris Jack and Kris De Bolle.
SITA Logos and names are trademark of SITA Group. www.sita.aero
For more information:
Aeriaa’s Airport Dashboard Project: www.aeriaa.com/aeriaas-airport-dashboard-project/
RabbitMQ: www.rabbitmq.com

